Debugging natively compiled Java code with NativeJDB

Co-authored by: Ansu Varghese, Research Software Engineer, IBM
In collaboration with:
Max Andersen, Dimitris Andreadis, Andrew Dinn, Stuart Douglas, Jason Greene, David Grove, David Lloyd, Thomas Qvarnstrom, Foivos Zakkak, Galder Zamarreno (IBM Research and Red Hat)
Quarkus is a cloud-native Java development framework, which allows Java code to be mapped to Kubernetes containers and compiled natively. Native compilation is useful for serverless computing, it avoids the overhead of running a JVM in containers and lets us execute serverless code directly. Debugging natively compiled code is not an easy task. It can be very different from the original Java source code due to extensive code optimizations, as well as differences in libraries used in native vs non-natively compiled code. In some cases, it is necessary to view both the source and the assembly code in order to gain better understanding of the program, further complicating the debugging task.
Native executables can be debugged with GDB, which is a C/C++ debugger in combination with a tool like emacs to step through the source code. However, these tools may not be familiar to a Java developer. Recently, extensions to VSCode and IntelliJ have been developed to alleviate this problem. Both these tools are specific to the IDE they extend, and need to be used in a Linux environment due to current limitations of Java native compilers.
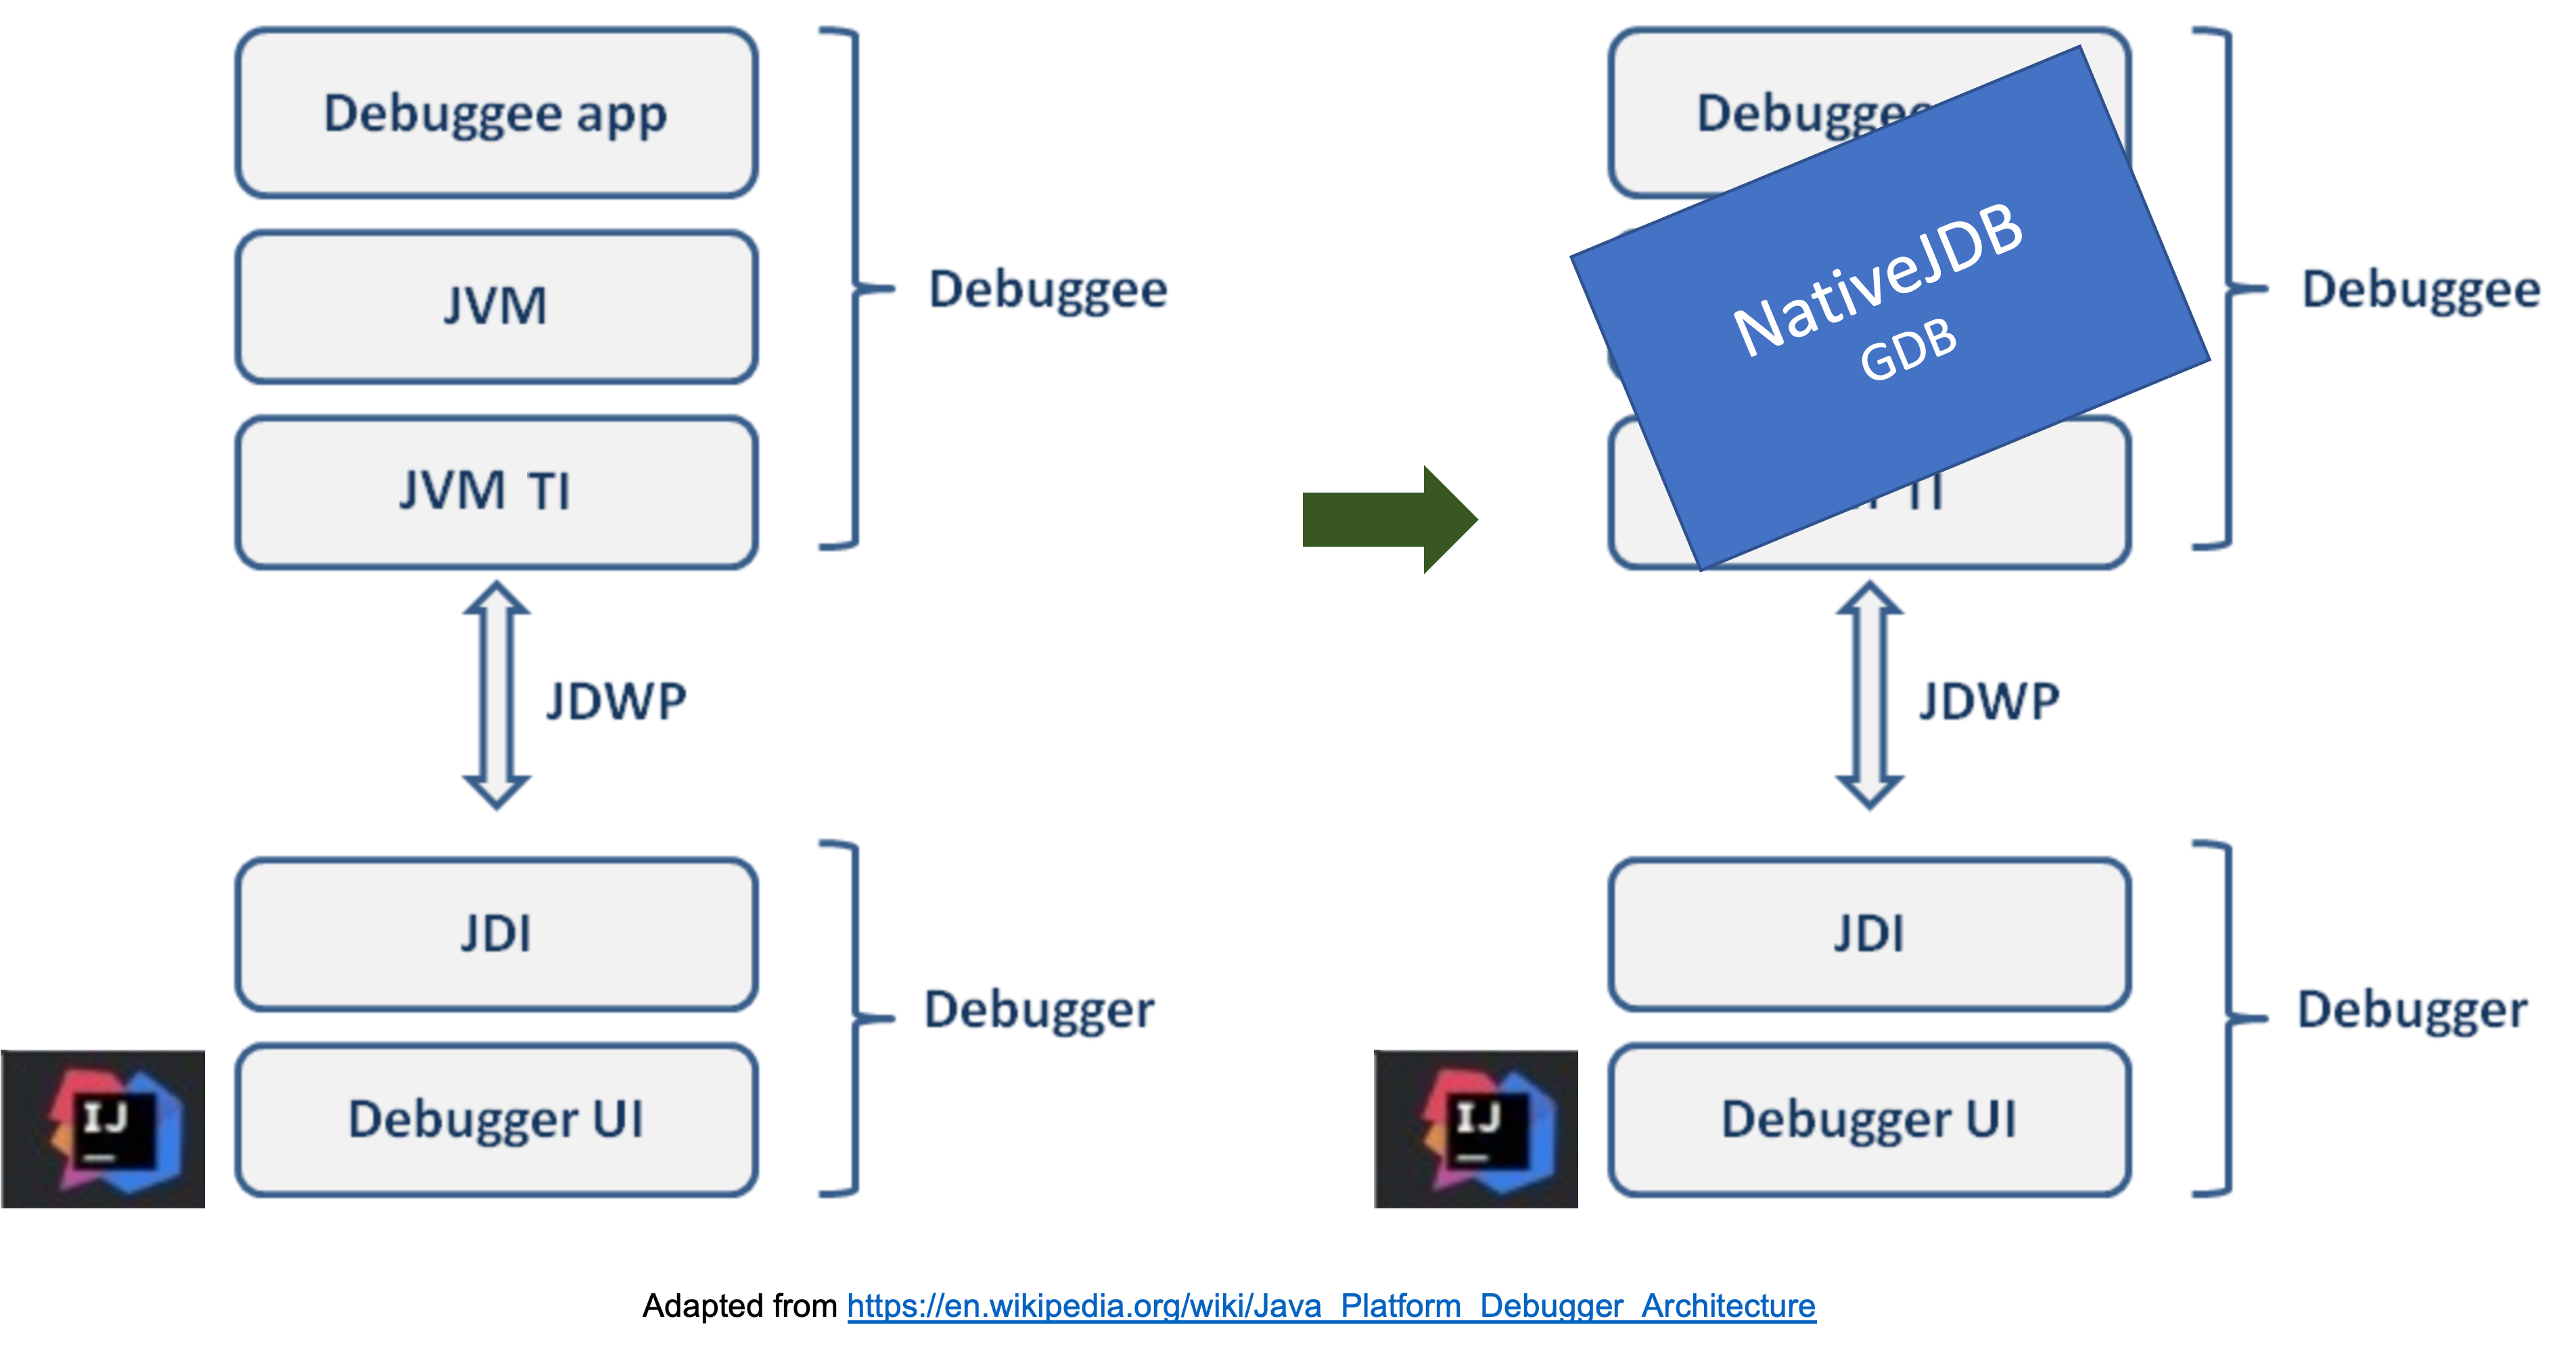
NativeJDB is an open-source tool that supports remote debugging of a natively compiled Java code. In principle, this allows debugging from any IDE that supports the Java Platform Debugger Architecture (JPDA), such as IntelliJ, Eclipse or VSCode. Attaching remotely means that the user can start a debugging session on any O/S, while the NativeJDB process itself runs in a Linux container. Our challenge is to bridge the gap between JPDA and the GDB, two stacks that don’t typically talk to each other! To achieve this we essentially teach the GDB to speak the Java Debug Wire Protocol (JDWP), used by IDEs to communicate with Java debuggers.
When writing Quarkus code, developers have the possibility of finding bugs with a regular Java debugger before compiling it natively. NativeJDB is useful when the observed behavior of the native executable is different than when the program is executed on a JVM. It can be used to explore optimizations and differences in libraries that account for behavioral anomalies. NativeJDB is not specific to Quarkus and can be used to debug any natively compiled Java code.
Architecture and Implementation
NativeJDB is a Java process that wraps GDB, which itself wraps the native executable, and it acts as a server that understands the JDWP protocol. It is similar to the JDWP agent used to control and debug a running Java process. In that case, the user can attach to such a process and can start debugging it. NativeJDB is used in a similar way: once it is started, the user attaches to it using a Remote Debug configuration from the IDE.
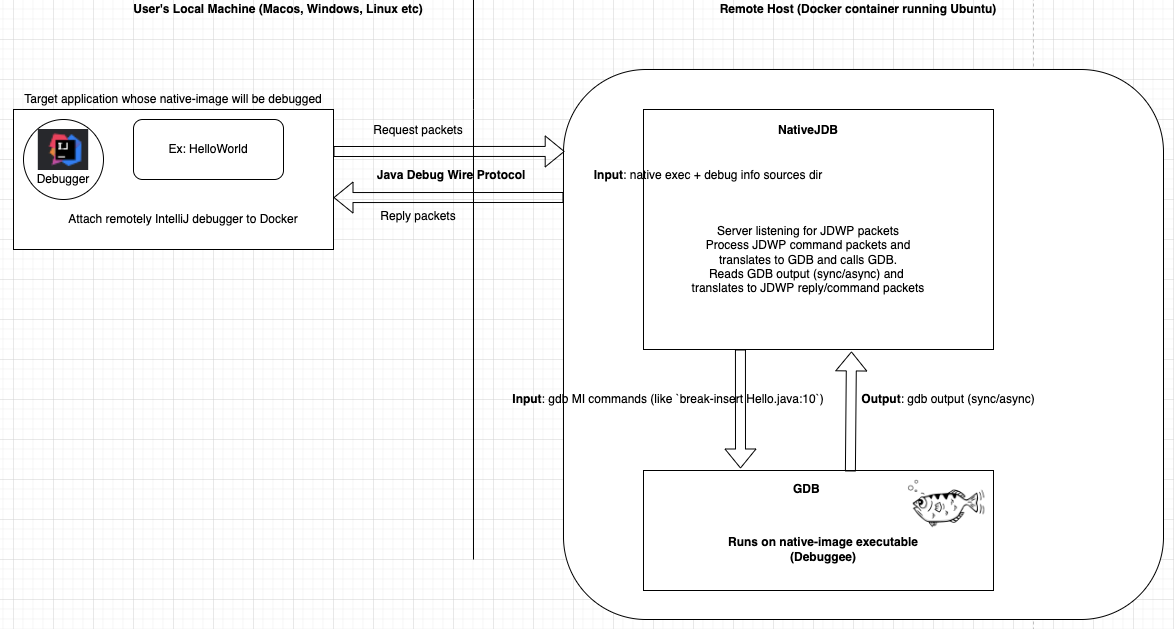
The IDE then communicates with NativeJDB using the JDWP. After the initial handshake and pleasantries (like capabilities and set of available classes), the protocol allows a user to manipulate the IDE’s interface, which triggers appropriate JDWP packets to be sent to NativeJDB. These packets are interpreted by NativeJDB and translated to GDB-MI commands. We use the MI interface to communicate with the GDB since it’s the recommended interface to build tools on top of the GDB. The GDB then responds to these commands, and the responses are translated back into JDWP packets and sent back to the IDE.
Communication between the IDE and the GDB can be both synchronous and asynchronous, including error messages. In some cases, a command from the IDE can result in both a synchronous and an asynchronous response. For example, setting a breakpoint has a synchronous response, but the corresponding breakpoint-hit is an asynchronous event that gets sent from NativeJDB to the IDE. In principle, NativeJDB can be used with any IDE that has a JDWP implementation, but it has mostly been tested and works with IntelliJ. It also does not require any changes or extensions to existing IDEs and works with the community as well as the commercial version of IntelliJ.
Today, native-image builders in GraalVM and qbicc produce debug information on a Linux environment with source mapping to the original Java source code (support for other platforms is in the works as well). NativeJDB’s architecture allows users to start a debugging session in an IDE running on any O/S and attach to a NativeJDB process running in a Linux container. So it does not require Linux to begin with. It also works with the community as well as the commercial version of GraalVM.
NativeJDB consists of a few different components. We use Docker to build a native executable and produce debug information for the debuggee Java application. Our Docker setup uses Ubuntu O/S. The frontend of NativeJDB is a set of classes that parse and build JDI data structures. Its backend parses and builds data structures corresponding to communication with the GDB.
NativeJDB has been using a scaffolding JVM to help it obtain certain static information and speed up development. So currently NativeJDB starts up the program as a Java process as well, in addition to running the native executable. It attaches to that process and suspends it to obtain general static information about the program. In the future, we will remove this scaffolding and replace with information coming from the GDB, though it has been very helpful in rapid prototyping.
NativeJDB in action!
To get started, you’ll need the following repos and follow the instructions in each:
Check out the following video to see NativeJDB in action!
And this video showing NativeJDB running on the GettingStarted Quarkus application:
特徴
-
Ability to show Java source in the editor and step through code
-
Works with IntelliJ and Java11
-
Works with GraalVM’s natively compiled images
-
Works with Qbicc’s natively compiled images (work in progress)
-
Debugging features using the IDE’s Debug Console itself:
-
Suspend / Resume
-
Set Breakpoints (Insert/Enable)
-
Clear Breakpoints (Delete/Disable)
-
Step Over / Step Into / Step Return (work in progress)
-
Stack Frames information in IDE debugger pane
-
Variables (Local + Static) values (work in progress)
-
View of assembly code within a stack frame (work in progress)
-
Multi-threading & thread info
-
NativeJDB does not support hot code replace. Also, very short running programs currently need a Thread.sleep(). This is due to the fact that NativeJDB today uses a scaffolding VM, and needs a little time to attach and suspend it. This problem will disappear when we get rid of the scaffolding in the future. There is also a known issue of breakpoints working only once in loops under some conditions (related to this graalvm issue), and the step operation sometimes continues instead.
まとめ
Through this blog, we have showcased a new debugging tool called NativeJDB that allows users to remotely attach and debug a natively compiled Java code. It provides a bridge between the Java debugging framework in modern IDEs and GDB. It does not require extensions to existing IDEs, and allows the user to start their debugging session on any O/S.
In the future, we can explore making NativeJDB work with other IDEs besides IntelliJ, which in principle should be possible.
NativeJDB is currently a working prototype, and we look forward to feedback, suggestions, and contributions!