Analysing Quarkus Native startup RSS consumption

During the development of Quarkus 2.13, we discovered that there was a startup degradation in native mode. One of the key aspects of this degradation was that RSS consumption on start up had gone up by about 10-15% compared to Quarkus 2.7. In this blog post you will learn how the Quarkus native RSS consumption debugging techniques described in the Quarkus native reference guide were used to diagnose this issue. You will also learn about recent updates in GraalVM that make doing this kind of analysis more convenient.
Our analysis showed that the RSS consumption for Quarkus 2.7 was about ~33MB while for Quarkus 2.13 it was about ~36MB, roughly a 10 % increase. Below we see how we measured the RSS consumption for Quarkus 2.7.6.Final:
$ getting-started/target/getting-started-1.0.0-SNAPSHOT-runner -Xmx64m
...
2023-07-21 10:13:11,304 INFO  [io.quarkus] (main) getting-started 1.0.0-SNAPSHOT native (powered by Quarkus 2.7.6.Final) started in 0.023s. Listening on: http://0.0.0.0:8080

$ ps -p $(pidof getting-started-1.0.0-SNAPSHOT-runner) -o rss=
33024
Similarly, below we see how we measured the RSS consumption for Quarkus 2.13.4.Final: In our environment, the RSS consumption had gone up to about ~36M, roughly a 10% increase:
$ getting-started/target/getting-started-1.0.0-SNAPSHOT-runner -Xmx64m
...
2023-07-21 10:24:38,529 INFO  [io.quarkus] (main) getting-started 1.0.0-SNAPSHOT native (powered by Quarkus 2.13.4.Final) started in 0.027s. Listening on: http://0.0.0.0:8080

$ ps -p $(pidof getting-started-1.0.0-SNAPSHOT-runner) -o rss=
36608
Since Quarkus 2.7 and 2.13 used different GraalVM versions (21.3 vs 22.3), we first investigated whether the increase in the startup time and RSS consumption was due to a change in GraalVM. This turned out to not be the case, as using the same GraalVM version on both Quarkus versions still resulted in similar differences.
We also profiled the startup time in JVM mode, and although we could observe some slight increase in heap usage, the RSS increase was not apparent at runtime. So, the challenge was to understand what was causing the RSS increase that seemed to only affect native mode and that was Quarkus specific.
In native mode we needed to look for system calls that increased RSS,
and investigate what caused them.
There are several system calls that can be used to allocate memory, e.g. malloc, mmap…etc,
but when we analysed the system calls emitted on startup,
we discovered that mmap calls were the prominent ones.
Following
Brendan Gregg’s Memory Leak (and Growth) Flame Graphs guide
on a Linux environment,
we were able to produce flamegraphs for the mmap system calls.
To obtain these flamegraphs, we capture the sys_enter_mmap system call events with perf record,
and then we generate flamegraphs with the recorded data:
$ sudo perf record -e syscalls:sys_enter_mmap --call-graph dwarf \
  -- getting-started/target/getting-started-1.0.0-SNAPSHOT-runner -Xmx64m
...
2023-07-21 10:13:11,304 INFO  [io.quarkus] (main) getting-started 1.0.0-SNAPSHOT native (powered by Quarkus 2.7.6.Final) started in 0.023s. Listening on: http://0.0.0.0:8080

$ perf script -i perf.data > out.stacks

$ /opt/FlameGraph/stackcollapse-perf.pl < out.stacks \
  | /opt/FlameGraph/flamegraph.pl \
   --color=mem \
   --title="mmap Flame Graph" \
--countname="calls" > out.svg|
The native executable above was created passing in
|
mmap calls happen for a variety of reasons,
but in the context of this blog post,
we’re interested in those mmap calls that are triggered by object allocations.
Not every object allocation triggers an mmap call.
Instead, each thread in SubstrateVM will allocate a heap chunk using mmap when the first object is allocated,
and it will use this heap chunk as long as there’s space for further objects allocated in the same thread.
When the heap chunk is full,
the thread will request a new heap chunk using mmap.
This pattern is called thread-local allocation.
HotSpot has a similar feature as well,
but there the heap chunk size is dynamically computed depending on multiple factors,
while on SubstrateVM the size is fixed.
At the time of writing, the default heap chunk size is 1MB,
but an upcoming change will make it 512KB instead.
We describe the object allocation as fast when the thread has a heap chunk cached and there’s enough space for the object.
We describe the object allocation as slow when the thread needs to request a new heap chunk via the mmap system call to satisfy the object allocation.
Slow allocations are the most interesting in this case,
because they give us a rough indication of which allocations are pushing the number of heap chunks up,
and therefore are pushing the RSS consumption up.
In SubstrateVM, stacktraces of the slow allocation path contain invocations to methods defined in the com.oracle.svm.core.genscavenge.ThreadLocalAllocation class that contain the slowPathNew prefix in their name .
E.g. slowPathNewInstance for plain objects or slowPathNewArray for arrays.
The areas of interest in the flamegraphs are those stacktraces that contain ApplicationImpl.doStart() method call,
because that’s the method that is responsible for starting up Quarkus applications.
We want to find out how many slow path allocations are visible in these stacktraces,
which are executed by the main thread.
Also, by looking at the stacktraces that cause these slow path allocations,
we can get an idea of which components might be allocation heavy.
If you focus the flamegraph on that method,
and then click on Search at the top right and type slowPathNew,
you can observe which of the sys_enter_mmap system calls are related to native heap memory allocation.
For Quarkus 2.7.6.Final, the flamegraph looks like this:

And here’s a screenshot highlighting the stacktraces that contain slow path allocations:
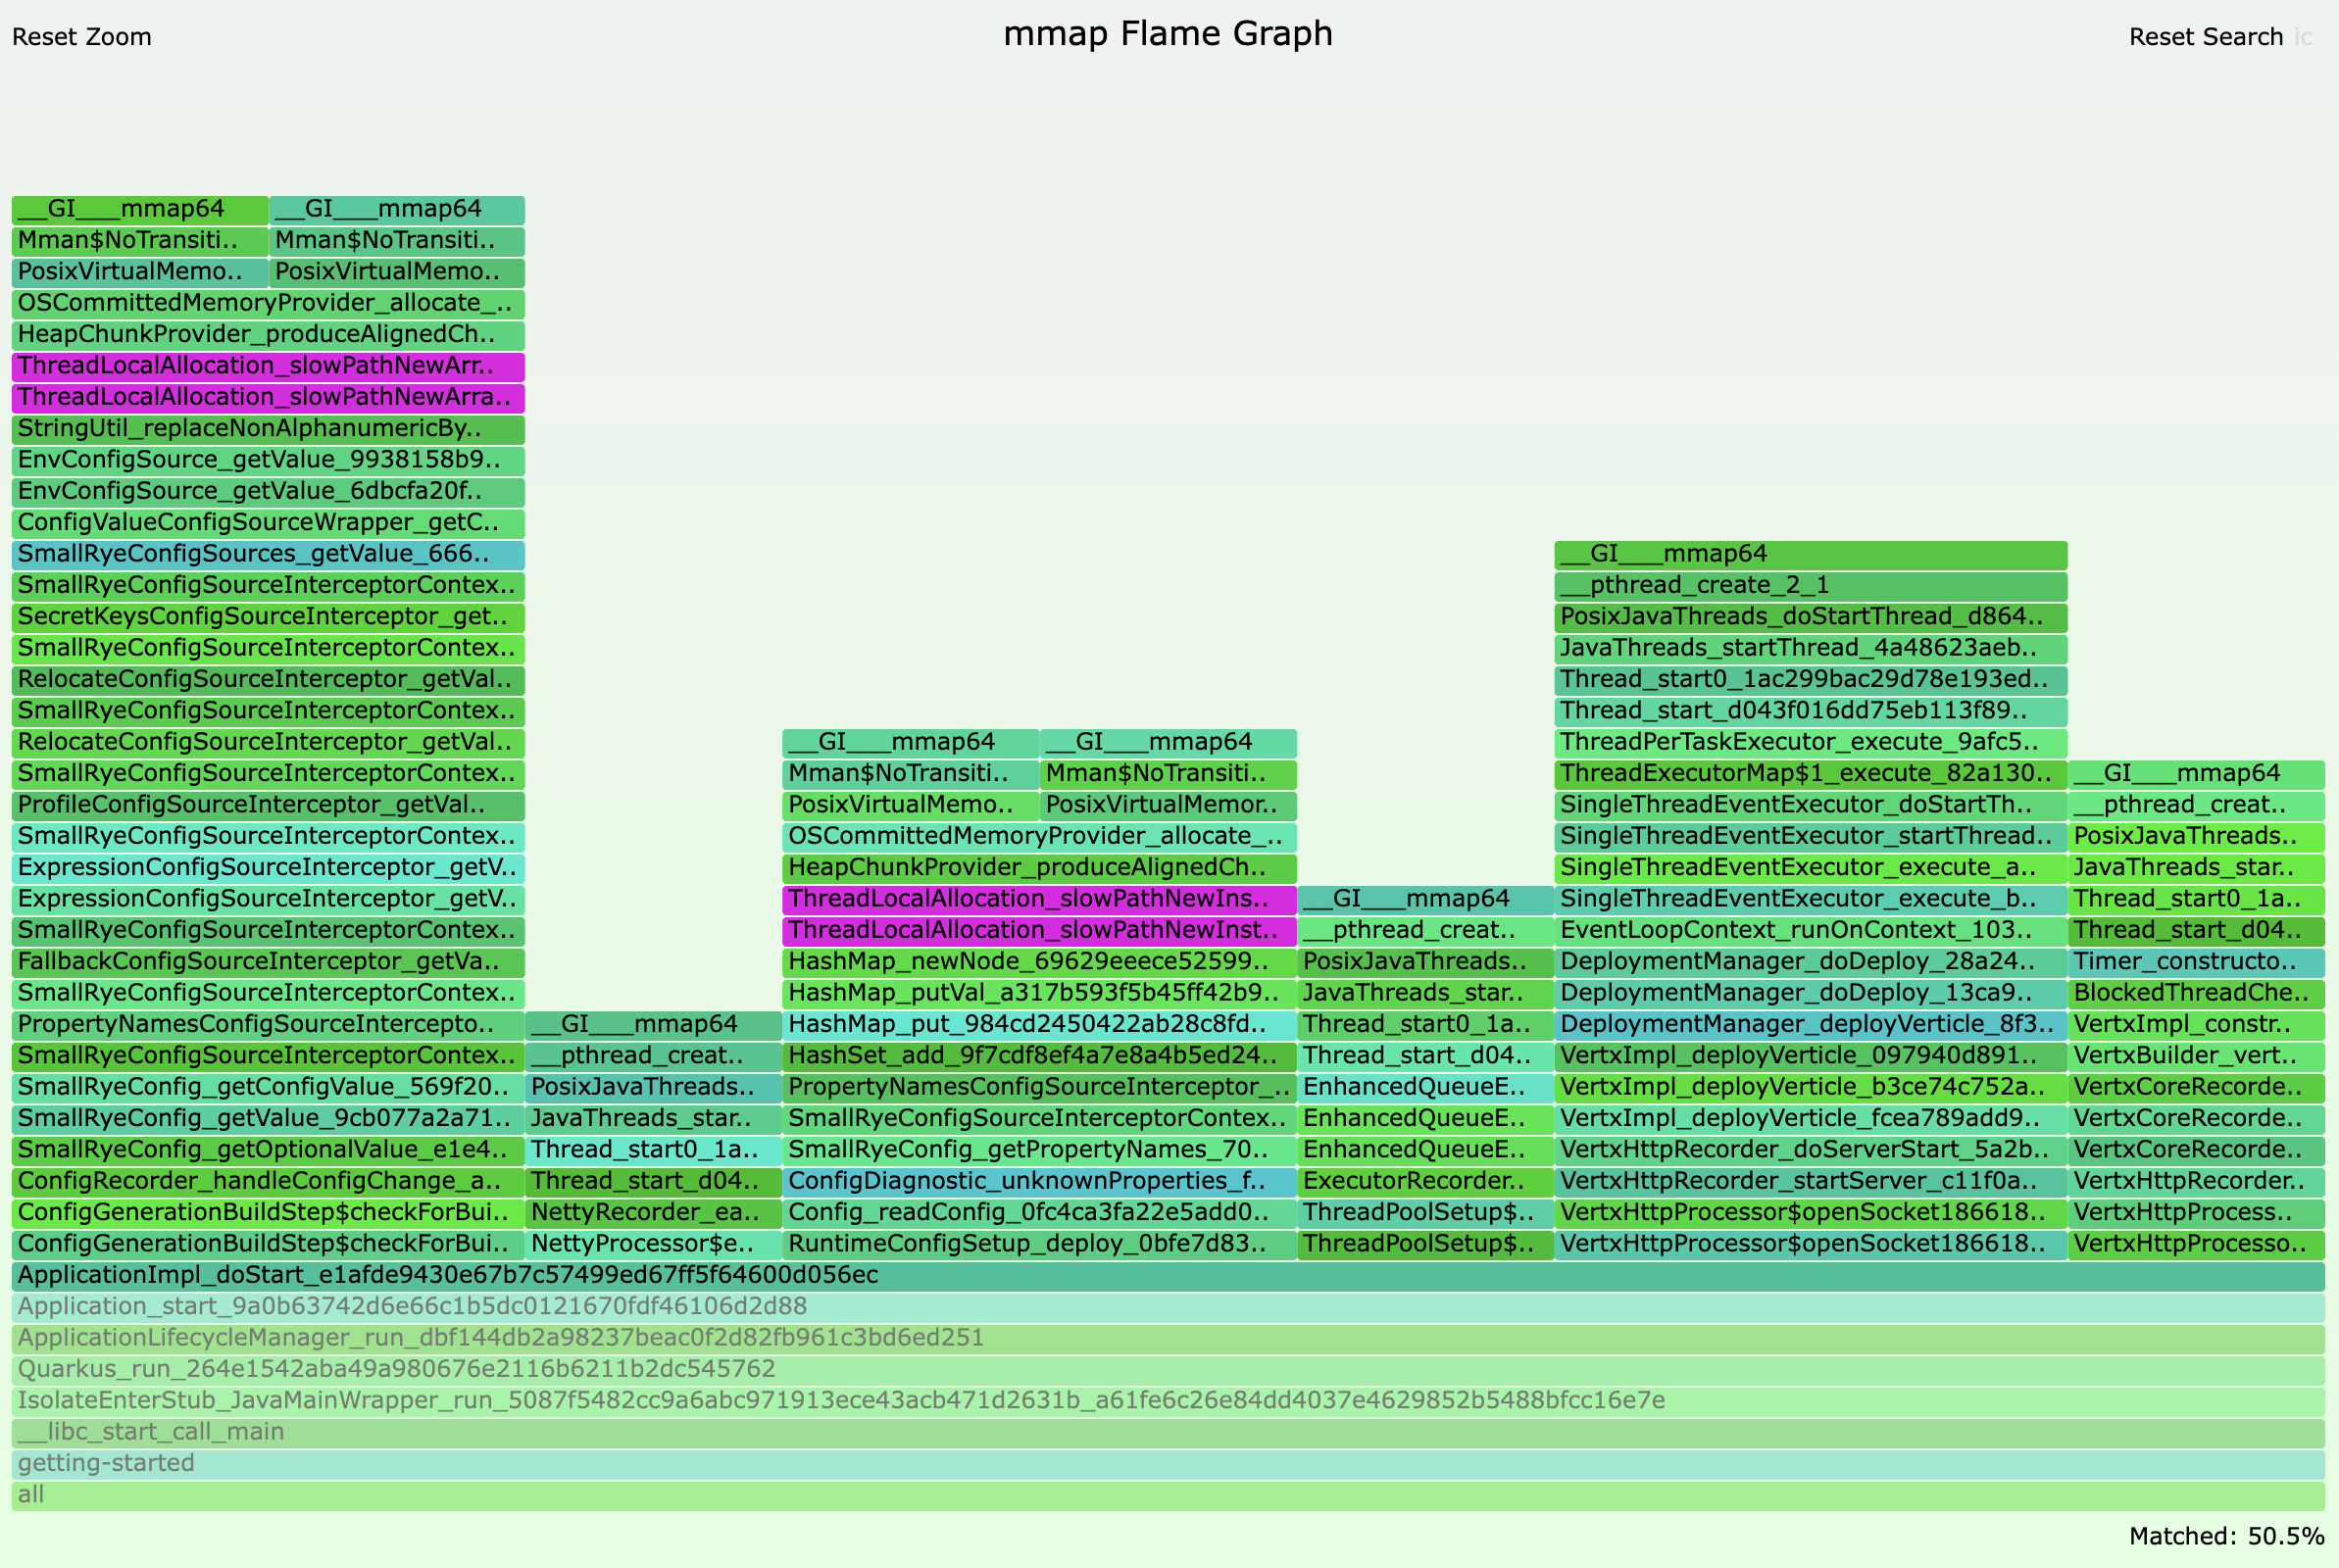
Observing the number of stacktraces that contain slowPathNew invocations above, i.e. 2, we can say that the main thread in Quarkus 2.7.6.Final allocates roughly 2MB of heap chunks.
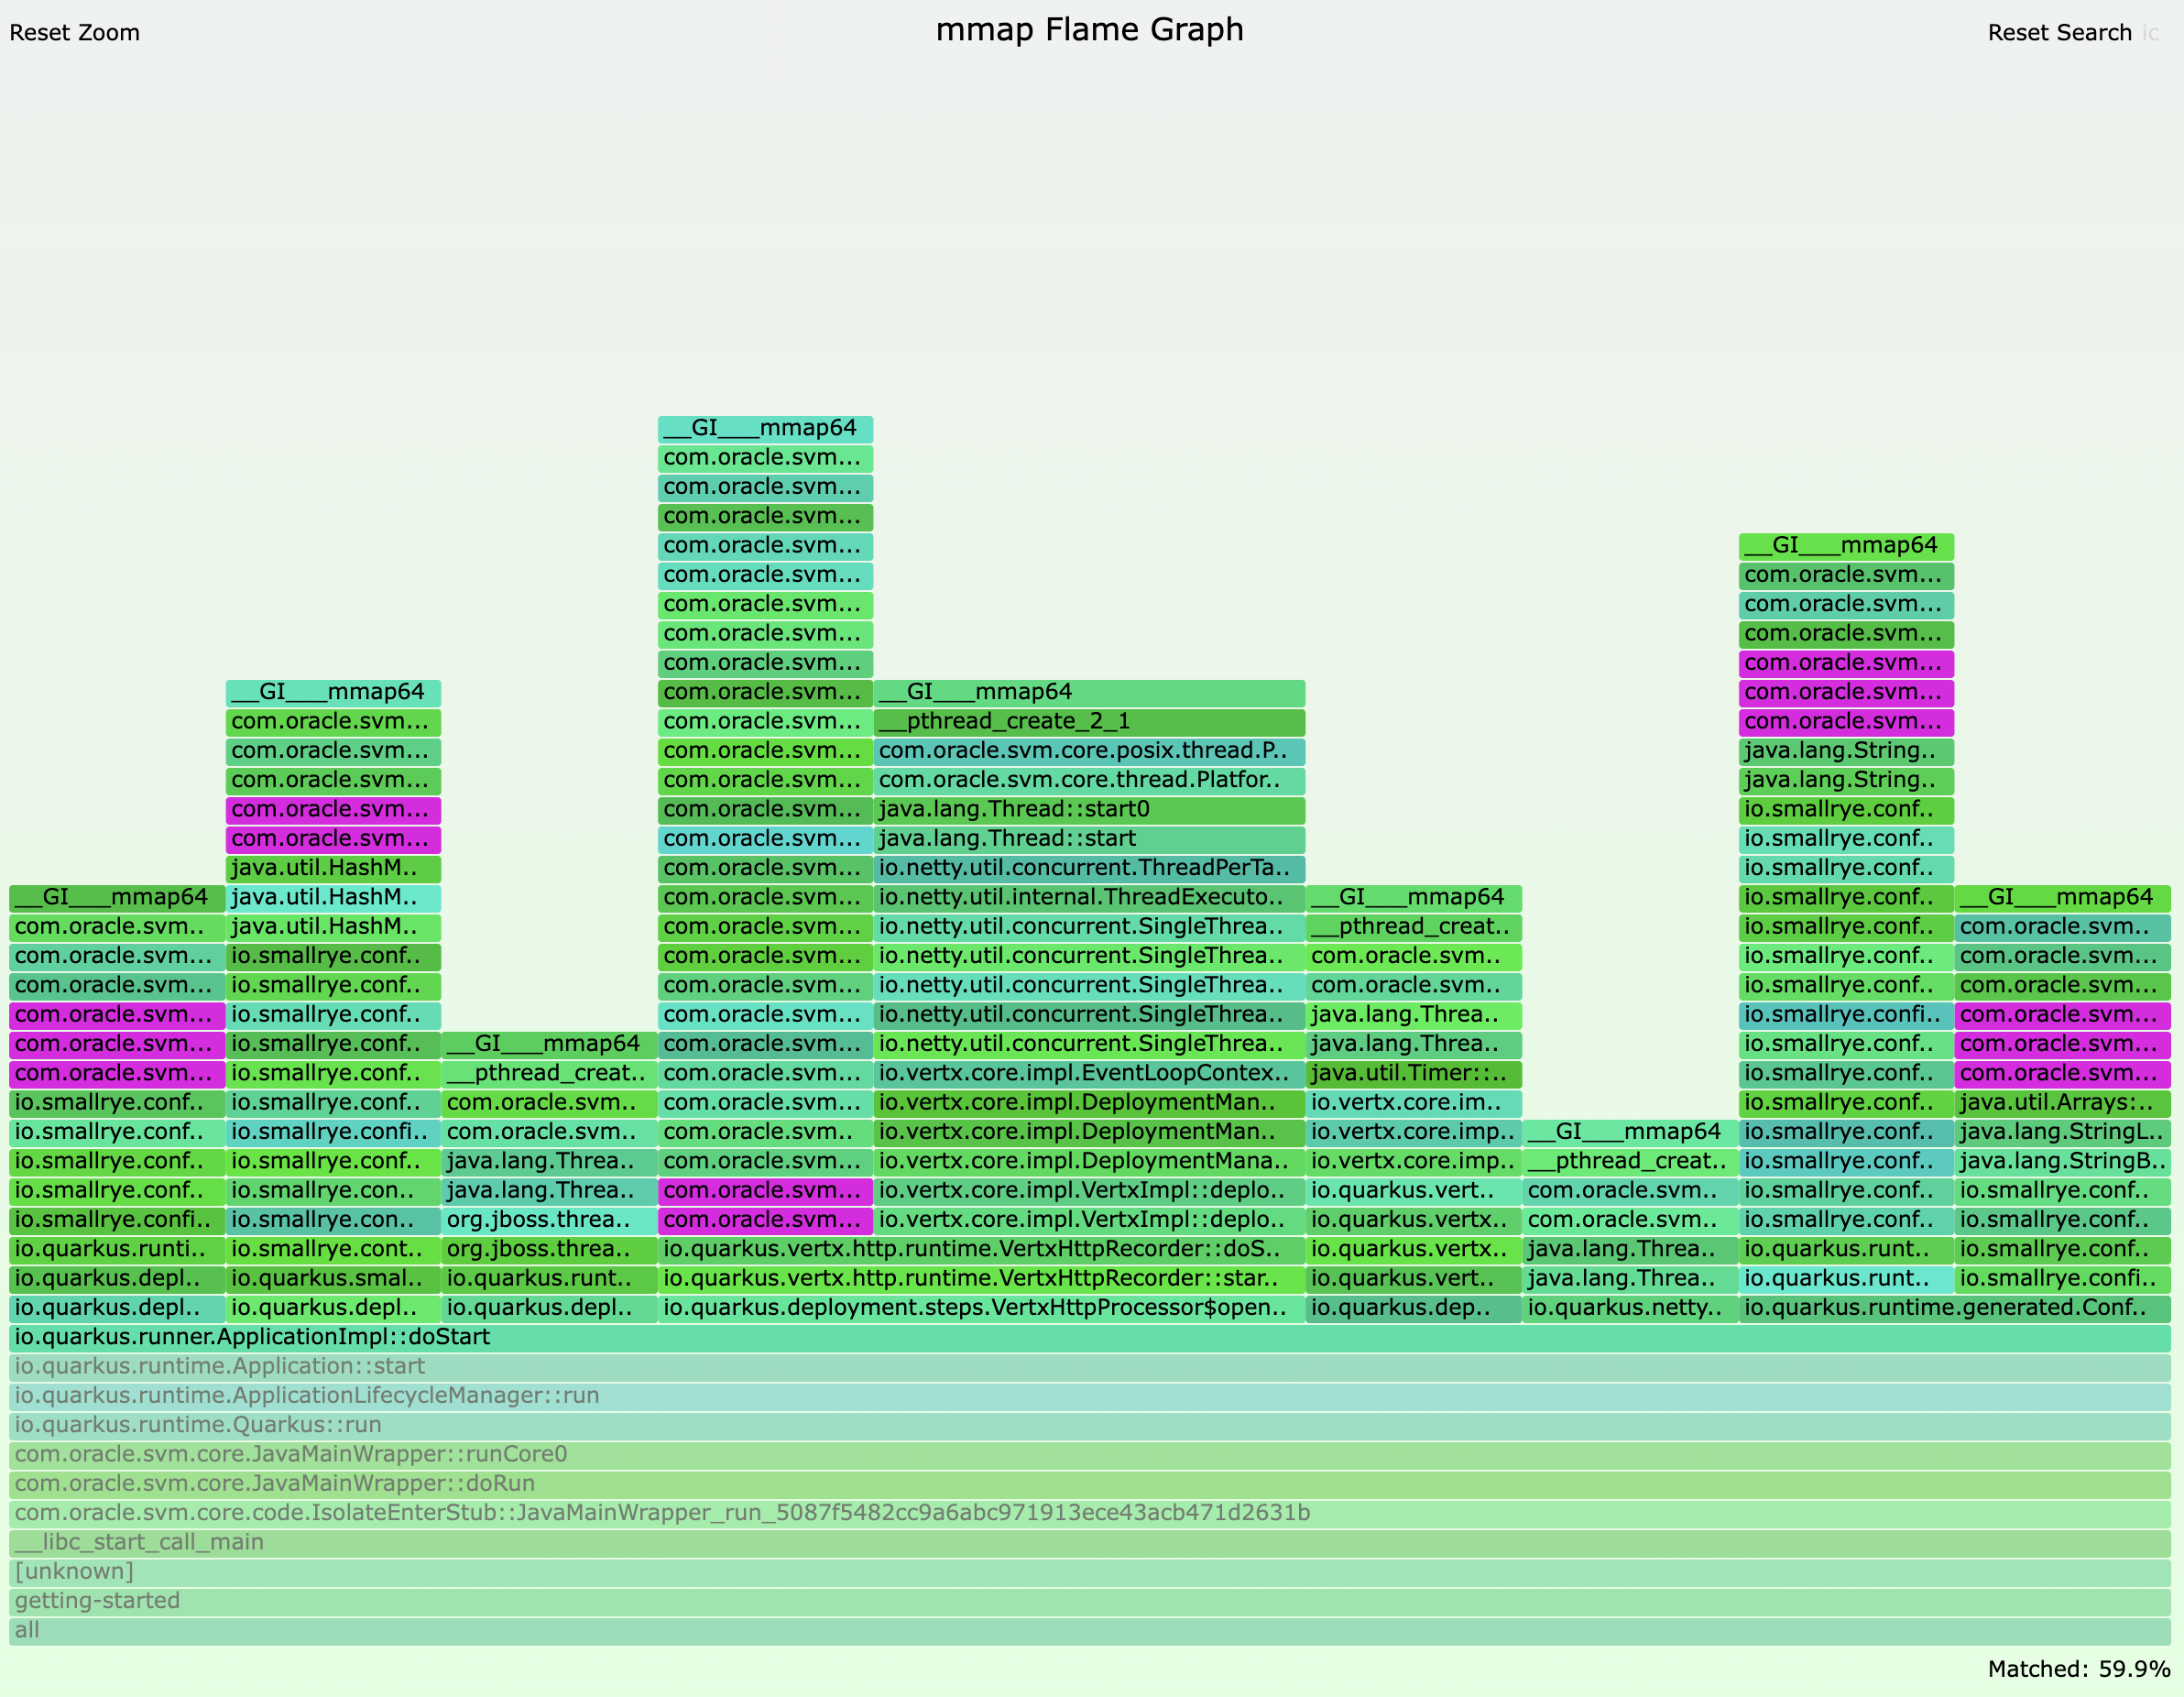
For Quarkus 2.13.4.Final, the flamegraph looks like this:

Focusing on the same area, we observe that the slowPathNew stacktrace count is 5 in this case, so the main thread allocates roughly 5MB of heap chunks:
The increase in object allocation at runtime startup between these two Quarkus versions, combined with the idiosyncrasies of how thread local allocation works in SubstrateVM, is what was causing the increase in RSS consumption. In other words, even though both HotSpot and SubstrateVM experience higher allocations, SubstrateVM’s fixed thread-local allocation heap chunk sizes make this more apparent, compared to the dynamic thread-local allocation logic in HotSpot.
Since then, improvements were made to the components that caused the extra object allocation. We were able to detect the changes that had caused these extra allocations by looking at the components that appeared in the stacktrace leading to slow allocations, and inspecting updates that had happened in those components. In this case, updates to the SmallRye configuration handling at startup caused the regression.
|
The stacktraces that cause slow object allocations give us an approximation on the components that cause memory usage increase. There could be situations where the stacktrace leading to a slow allocation is perfectly valid, but due to the non-deterministic nature of object allocation, the stacktrace just happens to be the one that caused a new heap chunk to be allocated. However, if you see multiple stacktraces in the same area, that’s probably a good hint that something in that area needs to be investigated. |
By Quarkus version 2.13.7.Final, the RSS consumption on startup was back to previous levels. The RSS regression was introduced by the changes in PR #26802, and the fixes in PR #29408 and PR #29842 brought it back down.
Performing the analysis with ObjectAllocationInNewTLAB JFR event
As newer versions of GraalVM implement more and more JFR events in native mode,
it also becomes easier to analyse Quarkus application performance.
For instance the recent release of GraalVM for JDK 17/20 adds support for the jdk.ObjectAllocationInNewTLAB event,
which would have highlighted the discrepancies in the Quarkus versions compared above.
Unfortunately, the Quarkus versions tested here are not compatible with this GraalVM version,
but we can give it a go with the latest Quarkus version to see what comes out.
First, we build the native Quarkus application with JFR support:
$ ./mvnw package -DskipTests -Dquarkus.native.monitoring=jfr -DnativeTo obtain jdk.ObjectAllocationInNewTLAB events,
a custom JFC configuration file is required.
We use jfr configure to generate it:
$ $JAVA_HOME/bin/jfr configure jdk.ObjectAllocationInNewTLAB#enabled=true --output newtlab.jfcThen, we start the Quarkus native executable with the necessary JFR flags:
$ getting-started/target/getting-started-1.0.0-SNAPSHOT-runner -XX:+FlightRecorder -XX:StartFlightRecording=settings=newtlab.jfc,filename=recording.jfr -Xmx64m
...
2023-07-21 12:25:33,739 INFO  [io.quarkus] (main) getting-started 1.0.0-SNAPSHOT native (powered by Quarkus 3.2.1.Final) started in 0.019s. Listening on: http://0.0.0.0:8080
After shutting down Quarkus,
we can use Adoptium’s Eclipse Mission Control
to visualize a flamegraph for all the jdk.ObjectAllocationInNewTLAB events.
We can also do a similar focus on ApplicationImpl.doStart() method to observe which slow path allocations get triggered from there:
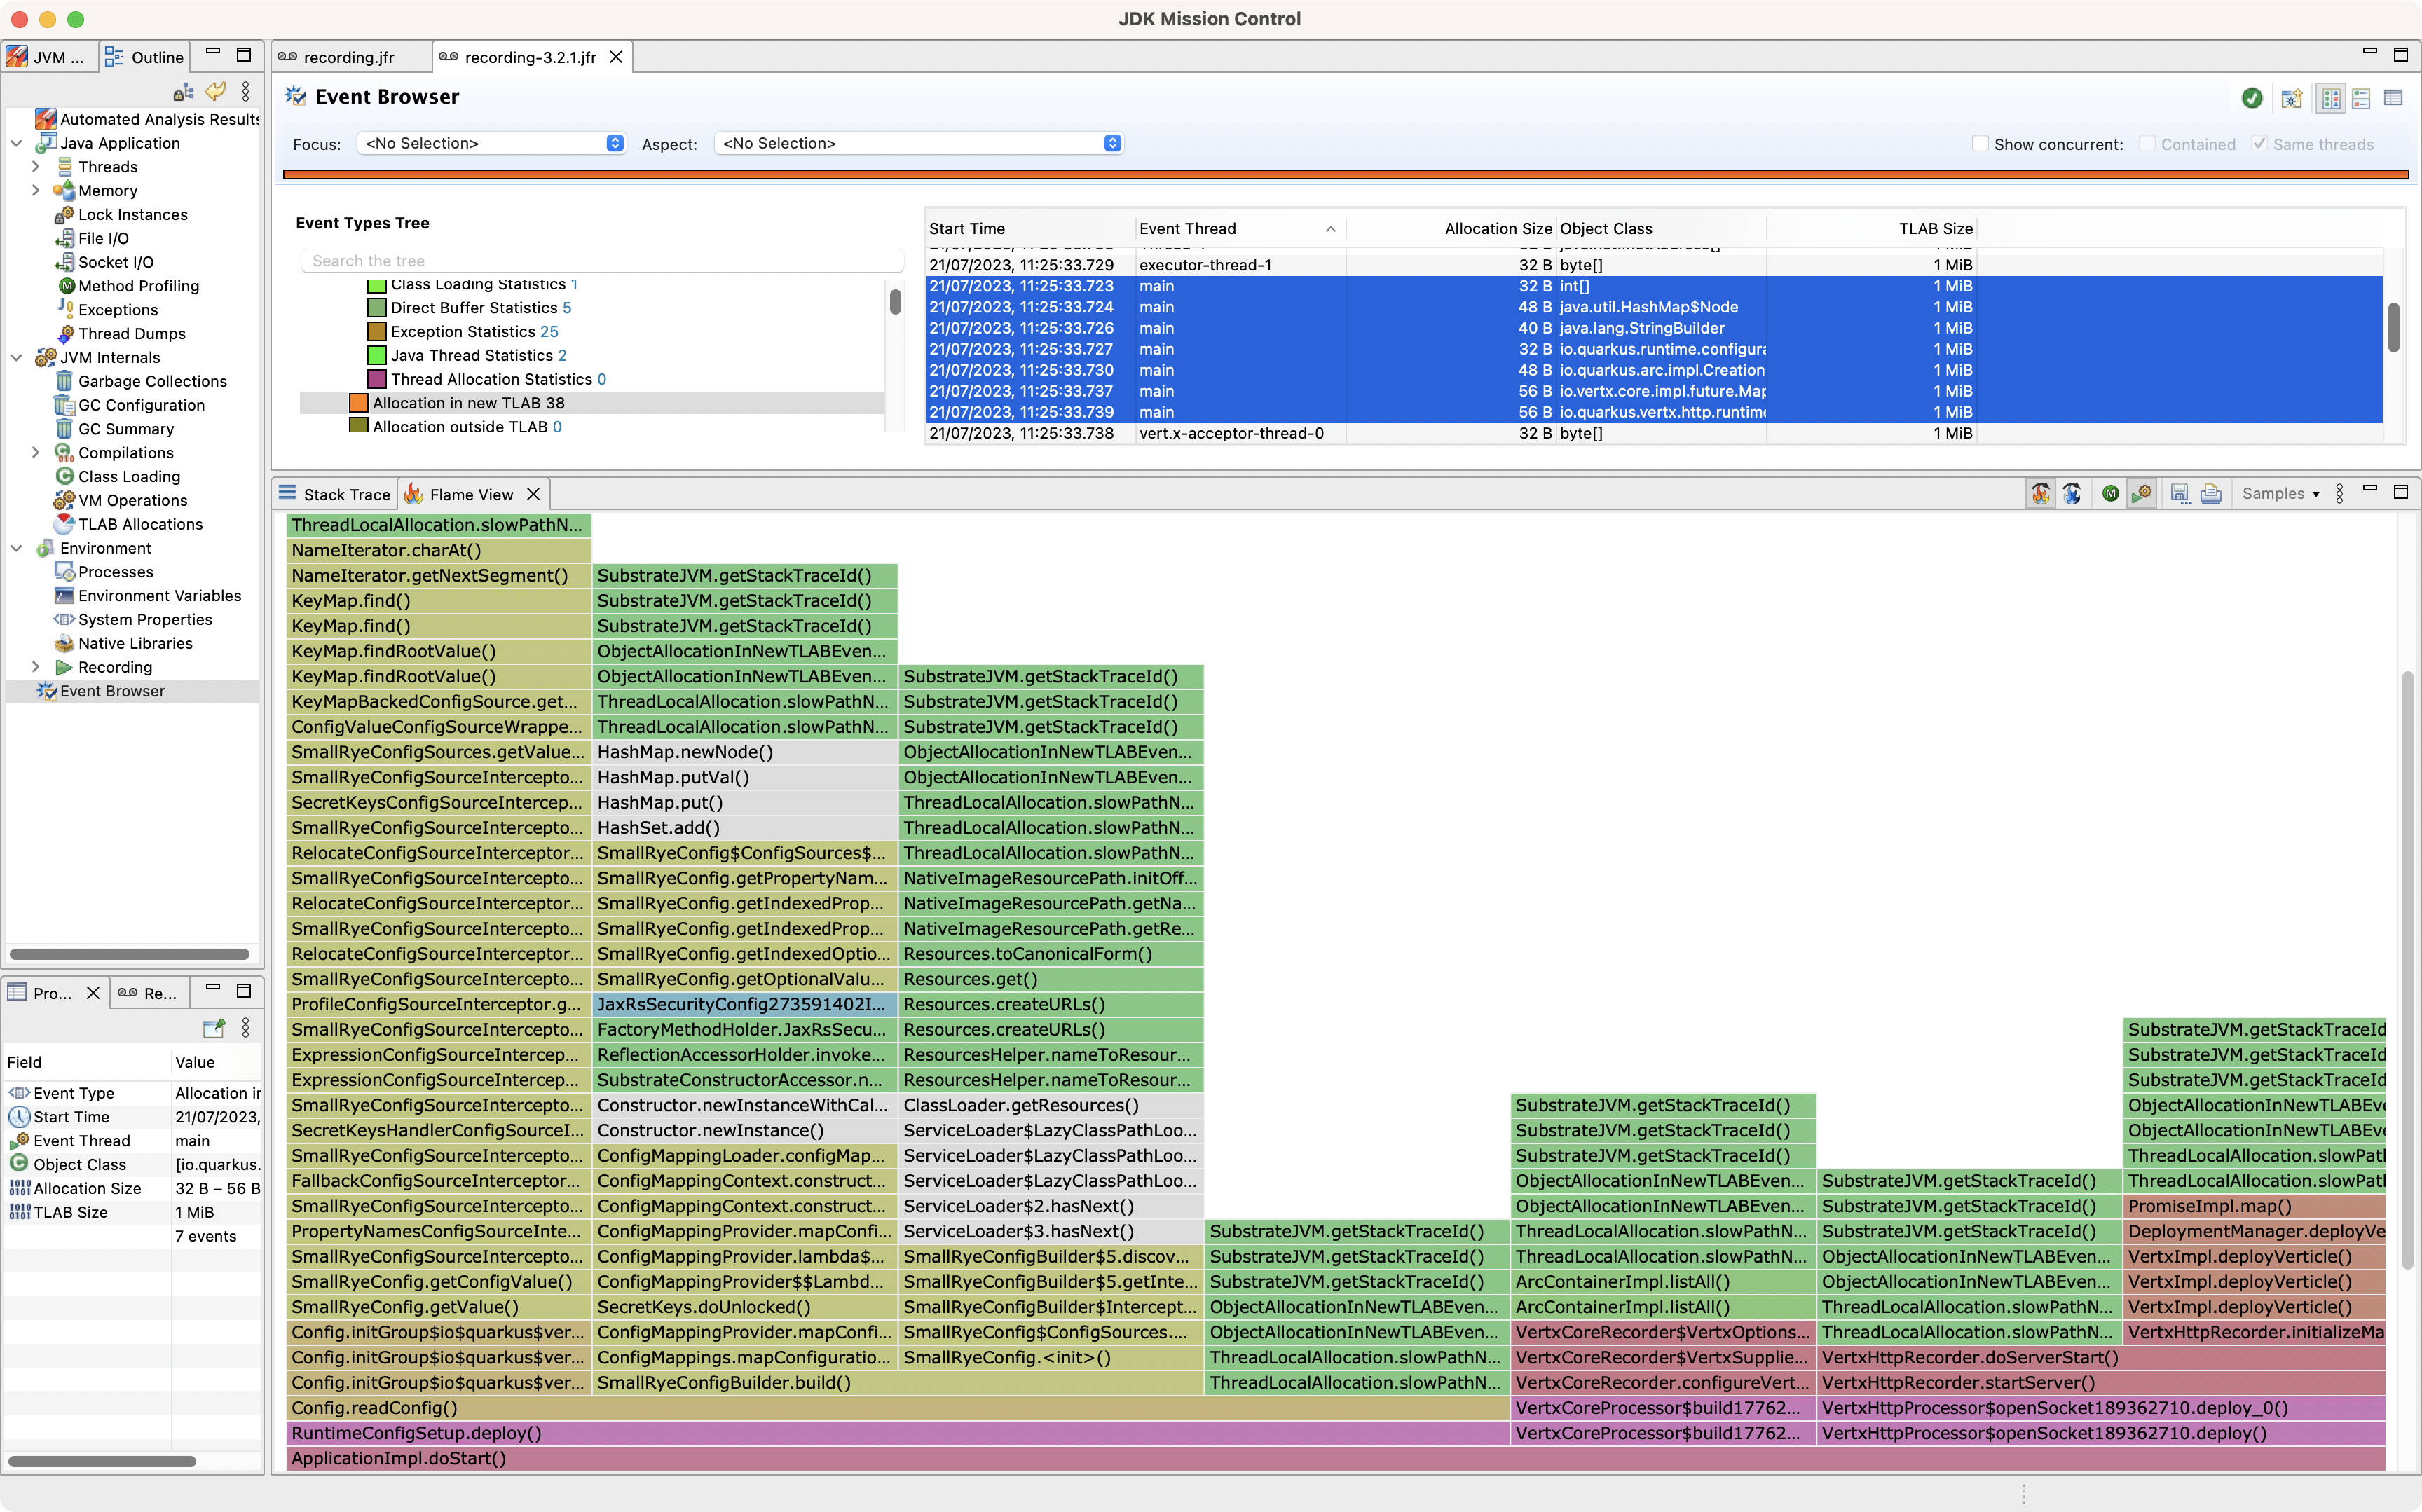
Looking at the flamegraph,
we can count 7 stacktraces for slow path allocations for the main thread.
Whether this is a problem,
or maybe code execution has shifted from another thread to main,
would be something we would need to explore further and see if there’s a regression.
If you encounter memory issues in your native applications, or any other type of performance issues, do not hesitate giving JFR a go. Robert Toyonaga has written a couple of blog posts on the latest JFR additions, see here to find out more.